Applications of Satellite Imaging Radar
M.R. Inggs and R.T. Lord
Department of Electrical Engineering,
University of Cape Town,
South Africa, Private Bag,
7701 Rondebosch,
http://www.rrsg.uct.ac.za/
email: mikings@eng.uct.ac.za
1. Abstract
Significant developments have been made in space-based radar systems and
technology since the first satellite with a radar payload was launched
(the Gemini radar). This paper presents an overview of some of the remote
sensing applications of satellite imaging radars, which range from topographic
mapping to forest and climate monitoring to the detection of oil spills
and the monitoring of natural disasters, to name just a few.
2. Introduction
Imaging radar systems (Radio Detection and Ranging) were developed in the
1950s mainly by the armed forces. Radar is an active remote sensing system
which means that it provides its own source of energy to produce an image.
It therefore does not require sunlight (as do optical systems) and data
can be acquired either by day or by night. Furthermore, due to the specific
wavelength of radar, cloud cover can be penetrated without any effect on
the imagery.
Synthetic Aperture Radar (SAR) is a technique for creating high
resolution images of the earth's surface. Over the area of the surface
being observed, these images represent the backscattered microwave energy,
the characteristics of which depend on the properties of the surface, such
as its slope, roughness, humidity, textural inhomogeneities and dielectric
constant. These dependencies allow SAR imagery to be used in conjunction
with models of the scattering mechanism to measure various characteristics
of the earth's surface, such as topography. SAR has become a valuable remote
sensing tool for both military and civilian users. Military SAR applications
include intelligence gathering, battlefield reconnaissance and weapons
guidance. Civilian applications include topographic mapping, geology and
mining, oil spill monitoring, sea ice monitoring, oceanography, agricultural
classification and assessment, land use monitoring and planetary or celestial
investigations.
 |
|
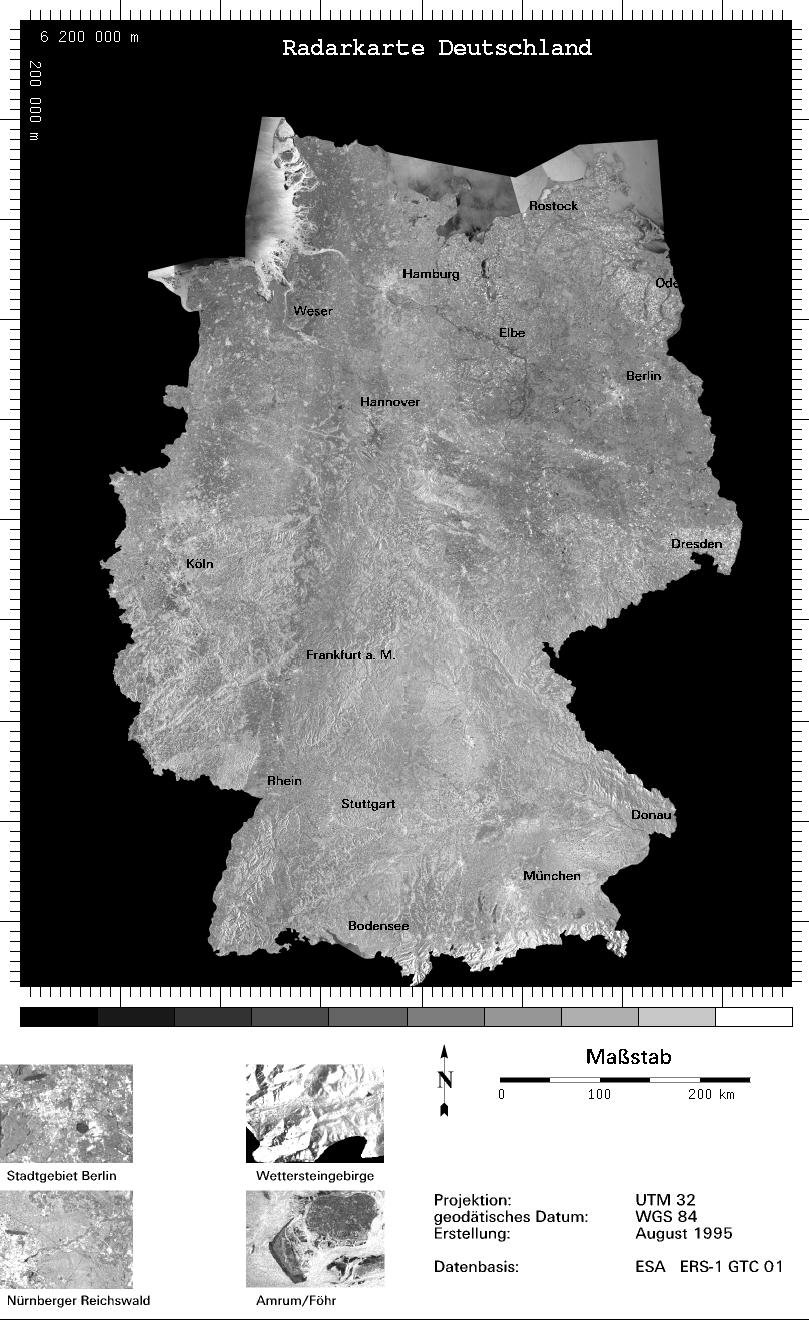
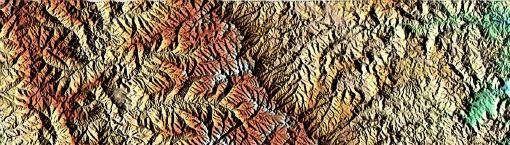
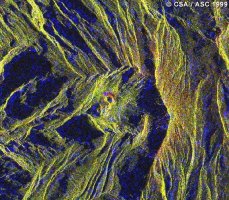
The image shows a SAR radarmap covering the whole of Germany.
The data used have been acquired by the high-resolution SAR sensor onboard
the remote sensing satellite ERS-1.
From 150 geocoded terrain corrected scenes an image mosaic with a pixel
size of 25m has been composed, which provides a data base for diverse applications. |
Another highly active research area in radar remote sensing is repeat
pass satellite SAR interferometry (InSAR). InSAR provides a means for measuring
displacements of the solid earth, glaciers, ice sheets, and fast sea ice
to an accuracy of fractions of a radar wavelength (a few cm) during the
time intervals between observations, using synthetic aperture radar (SAR)
imagery. Since the launch of the first European Remote Sensing satellite
(ERS-1) in 1991, this rapidly-evolving technology has been employed to
measure, for example, coseismic displacements; the motion of glaciers and
ice sheets in Alaska, Greenland, Antarctica and elsewhere; retreat of the
grounding line of a major West Antarctic ice stream; deflation of a European
volcano following an eruption; and crustal extension of potentially active
volcanic vents in SW Alaska. In addition, InSAR can be employed to derive
digital
elevation models (DEMs) of the Earth's surface. Other applications
of InSAR include prediction of earthquakes and volcanic eruptions, ice
flow mapping, forest mapping and land classification. The limitations caused
by atmospheric effects presently seem to be the most fundamental and severe
limitation for this otherwise incredibly sensitive technique. Furthermore,
the correlation map that used to be "just" a byproduct of the interferometric
processing, and at best a measure of the interferogram quality, is now
becoming important information in itself. Correlation maps are used for
volume scattering estimation and forest height measurement as well as for
land use classification.
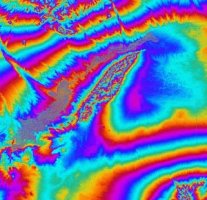
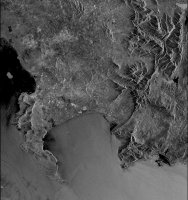
|
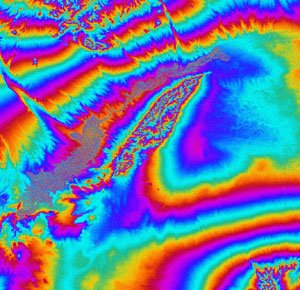
Interferogram
|
Radar Image
|
|

|
|
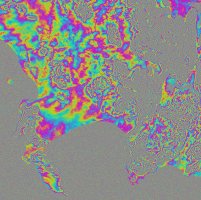
The scene shows an area near White Sands, New Mexico, USA and covers
approximately 50 km x 150 km.
The individual phase values appear as coloured rings. The steeper the
slopes, the closer the fringes. Topography can already be seen directly
in the interferogram.
|
|
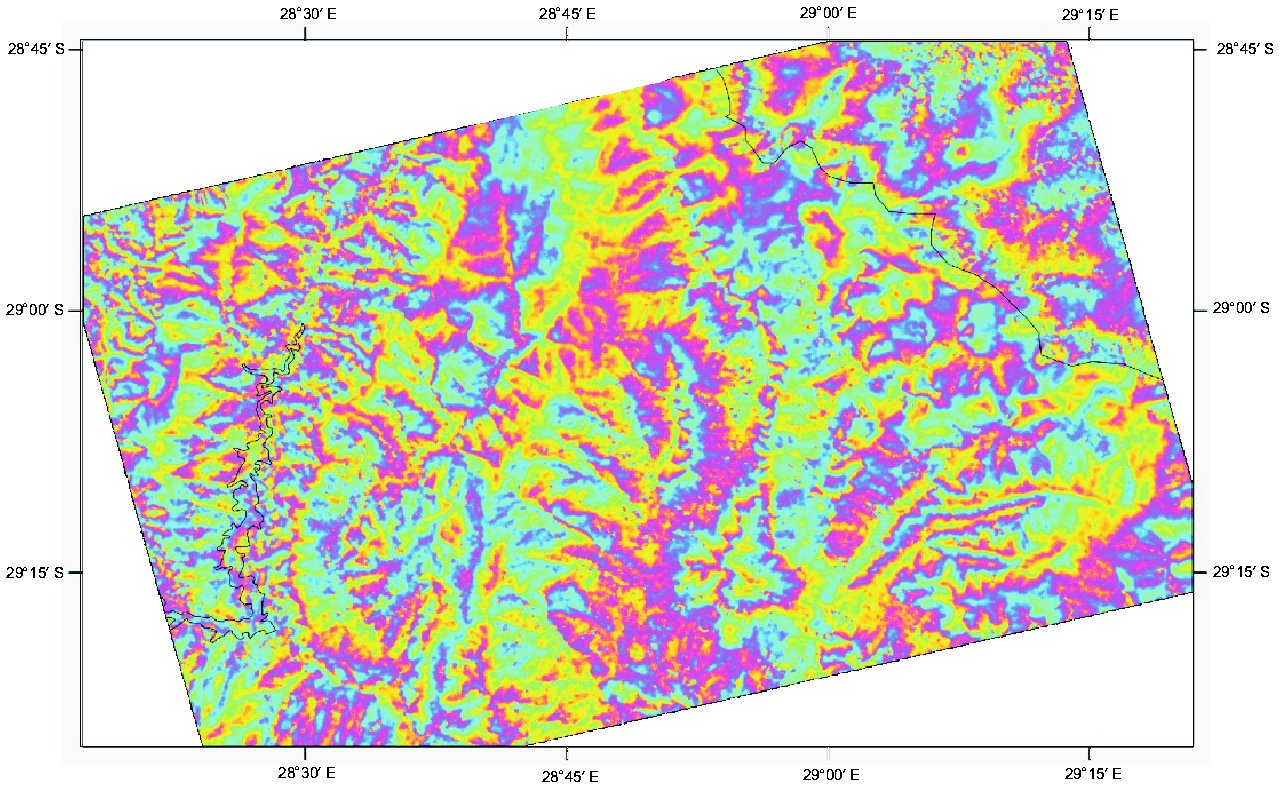
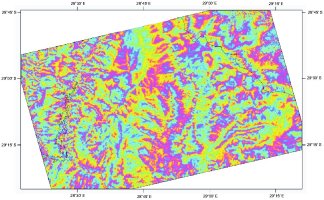
Another application area in radar remote sensing is hydrology, including
the retrieval of soil moisture and snow water content, glaciology, and
radar mapping of vegetation. Hydrology is an area where SAR and also active
imaging radar of lower resolution have much to offer. In relation to soil
moisture estimation, polarimetric data have proven capabilities. Difficult
problems include the vegetation cover and the requirement that the soil
type/texture needs to be known. There is, however, hope that these problems
can be mitigated. Using lower frequencies, e.g. P-band, enables penetration
of low to moderate vegetation. More interestingly, the soil texture can
potentially be estimated from a time series of measurements during a drying
period following precipitation.

False colour intensity composite of two ERS passes over the Welkom goldfields.
The mapping of forest and biomass, as well as agricultural crops, are
also active application areas. Many techniques show promise with respect
to forest and biomass mapping and it has been shown that the backscatter
coefficient of very low frequency systems (UHF and VHF) does not saturate
at as small biomass values as the more common frequencies at L-band and
C-band.
Most of the information contained in the following sections has been
obtained from the internet, and the authors would like to acknowledge the
following websites:
3. Remote Sensing Platforms and Sensors
The following is a list of some of the more well-known spaceborne remote
sensing platforms and sensors. A more complete list can be obtained from
http://quercus.art.man.ac.uk/rs/sat_list.cfm
which currently lists 87 remote sensing platforms and sensors.
-
ERS-1/2
-
- European Remote Sensing Satellite 1 and 2. The first satellite
in the ERS series was launched in June 1991, and its successor (ERS-2)
in April 1995. Since 1991, an almost global coverage of the Earth's surface
has been attained with the satellite's SAR (Synthetic Aperture Radar) instrument.
The ERS satellites have Sun-synchronous, near polar, quasi- circular orbits
with a mean altitude of 785 km and an inclination of 98.5°
. Most of the ERS-1 mission was performed with a 35-day cycle. ERS-2 only
operates in a fixed repeat cycle of 35 days, which means that a particular
site is covered every 16 days (figures for Equator latitude).
-
-
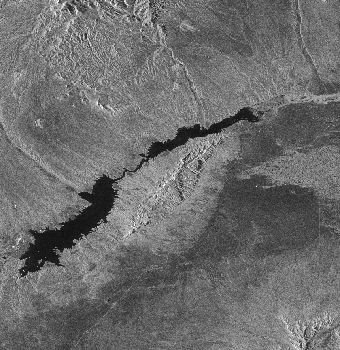
|
|
ERS multi-look intensity image and the flattened interferogram of the
Western Cape region.
Tandem ERS data was used at UCT to derive a DEM of the Cape Town area.
This turned into a study of aberrations found in single antenna interferometry.
The aberrations have been attributed to atmospheric perturbations, or inconsistencies
between image acquisitions.
|
|
-
-
-
JERS-1
-
- Japanese Earth Resources Satellite - 1.
-
LightSAR
-
- A JPL lead US project, "low-cost", lightweight, L-Band system, focused
on interferometric SAR applications, e.g. natural hazards (seismic and
volcanic deformation), ice flow velocity mapping; and low frequency applications,
including biomass mapping, soil moisture, and snow water equivalent mapping.
-
RADARSAT
-
- Commercial, very similar to ERS.
-
SEISM
-
- Solid Earth Interferometric Spaceborne Mission, a French concept,
based on the basic idea of implementing a low cost SAR which will extend
the ERS-1/2 capability and ensure acquisition of data for very long time
span interferograms in areas where coherence allows such long baselines.
Key applications would for instance be forest clear-cut monitoring.
-
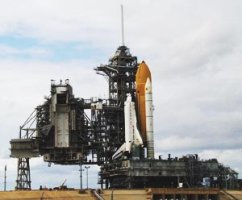
SIR-C/X-SAR
-
- Shuttleborne Imaging Radar.
-
-
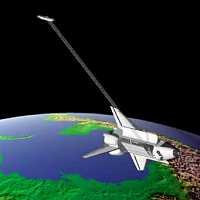
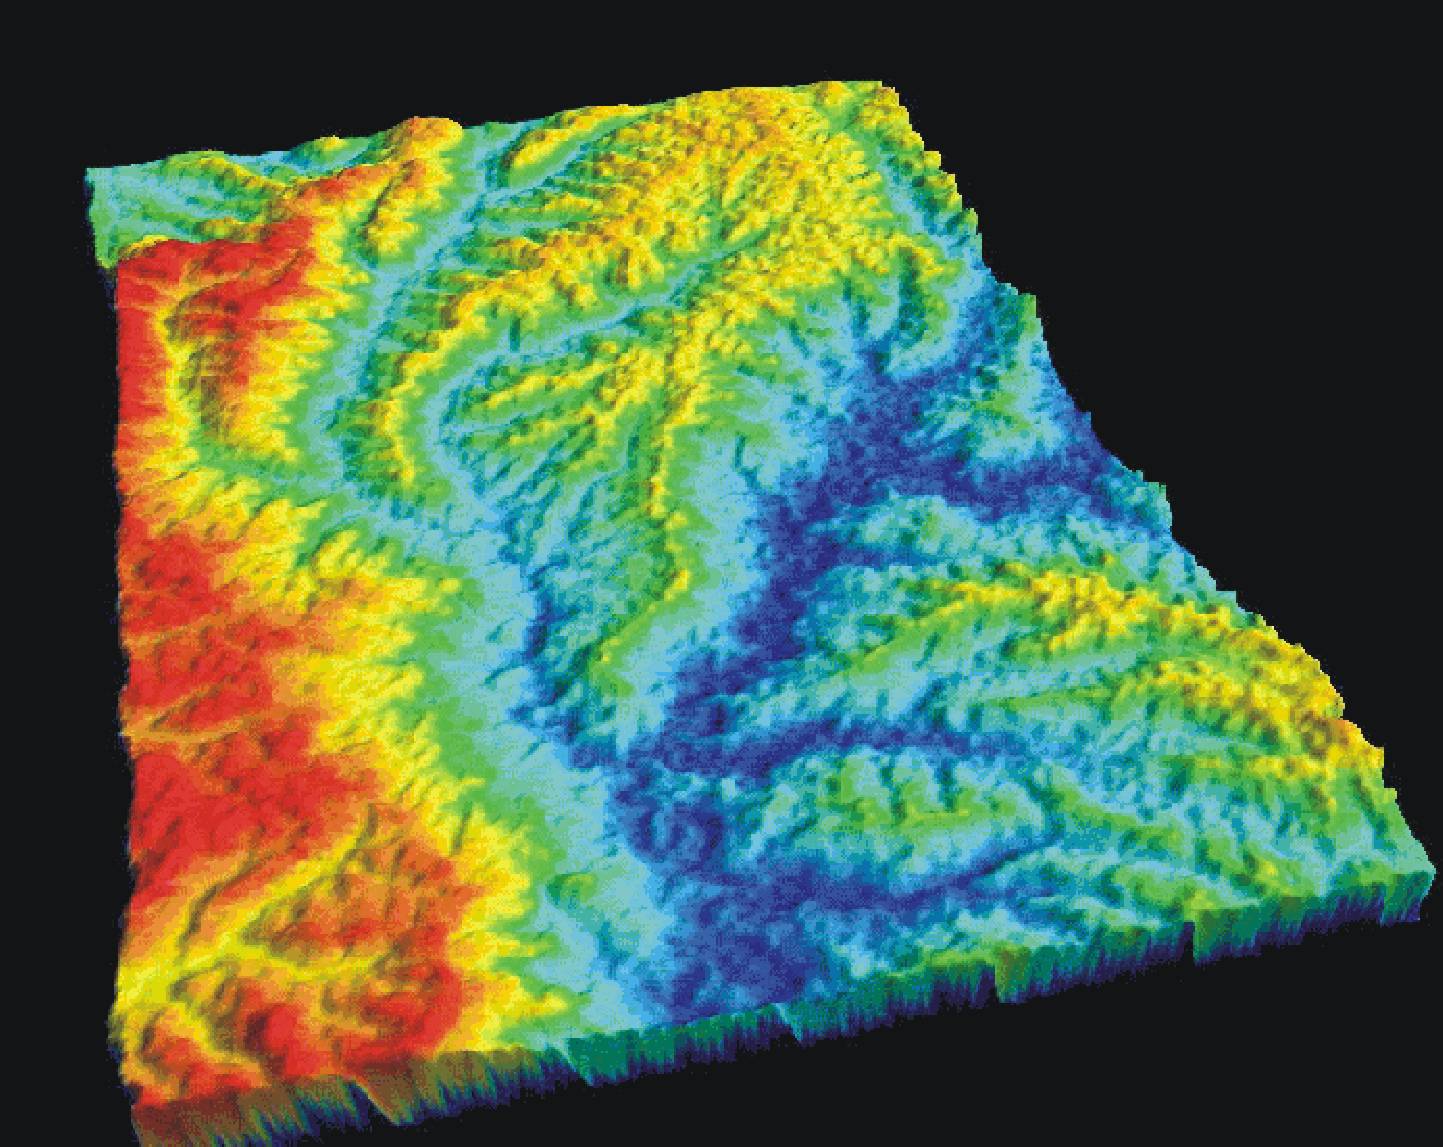
SRTM
-
- Shuttle Radar Topography Mission.
-
-
-
The SRTM mission is an important milestone in the history of remote sensing.
In eleven days it collected about 18 Terabytes of radar measurements which
will allow scientists to virtually reconstruct a 3-dimensional model of
80% of the Earth's continental area. The collected radar images will be
converted to digital elevation models (DEMs) spanning the globe between
60° North and 58°
South. The "virtual Earth" will be reconstructed as a mesh of 30 m spacing,
and is accompanied for each point by a measure of the reflected energy
of the radar signal, the intensity image. These data will become an important
reference for comparison and correlations with older and future satellite
or other Earth Observation (EO) data. SRTM is a valuable asset for
many applications ranging from geology, tectonics, hydrology, cartography,
to navigation and communications.
-
-
|
|

|
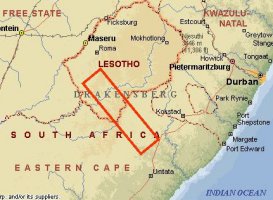
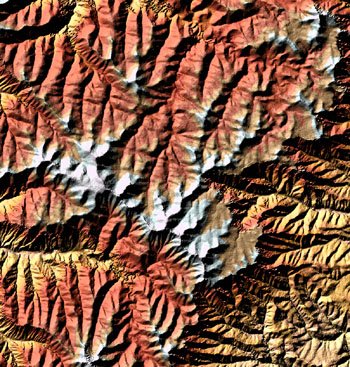
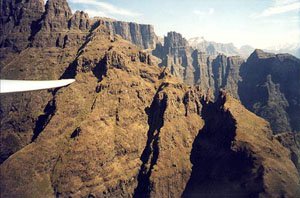
The most elevated stretch of the Drakensberg, in eastern and southern
Lesotho, is composed of severely eroded basalt capping a sandstone base.
Its pinnacles and broken and fractured blocks present a steep eastern scarp
along the length of the border between Lesotho and KwaZulu/Natal.
|
|
|
-
-
4. Remote Sensing Applications by Instrument
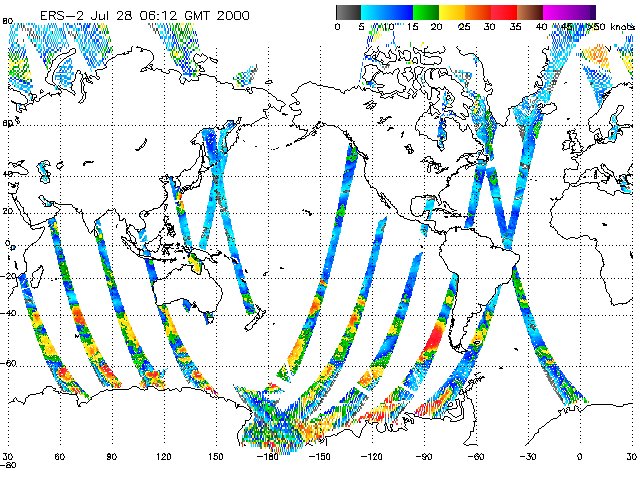
4.1 Wind Scatterometer (WSC) Applications
Wind scatterometers use accurate measurements of the radar backscatter
from the ocean surface when illuminated by a microwave signal with a narrow
spectral bandwidth to derive information on ocean surface wind velocity.
At a given angle to the flight path of the satellite, the amount of backscatter
depends on two factors, namely the size of the surface ripples of the ocean
and their orientation with respect to the propagation direction of the
pulse of radiation transmitted by the scatterometer. The first is dependent
on wind stress and hence wind speed at the surface, while the second is
related to wind direction.
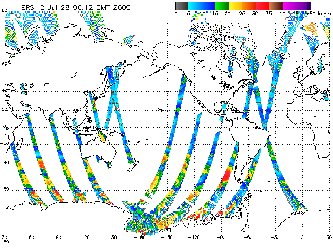
This map displays the ocean surface winds at 10m on the 28th July 2000
from the ERS-2 scatterometer.
Scatterometer instruments aim to achieve high accuracy measurements
of wind vectors, and resolution is of secondary importance. The resolution
of the ERS scatterometer is 50 km, though the grid sampling is 25 km. Because
the scatterometer operates at microwave wavelengths, the measurements are
available irrespective of weather conditions. The assimilation of scatterometer
data into atmospheric forecasting models greatly improves the description
of cyclonic features so important in predicting future weather patterns.
There are numerous other applications, such as the measurement of sea ice
extent and concentration, and emerging land applications such as regional-scale
monitoring of ice shelves, rainforests and deserts.
4.2 Radar Altimeter (RA) Applications
The radar altimeter is designed to make accurate measurements of the satellite's
height above the sea surface which is then converted to the sea surface's
height above a reference ellipsoid. When the altimeter takes a height measurement,
it is measuring a height contributed to by many different types of phenomena,
from the underlying marine geoid, through the large-scale general circulation
of the oceans, to mesoscale eddies 100 km across. In addition to highly
precise height measurements, the altimeter makes measurements of the heights
of waves that appear in its footprint, and of surface wind speed.
Applications of the radar altimeter include:
-
Measuring the marine geoid.
Information has been extracted from altimeter data, particularly that
provided by the high resolution dedicated Geodetic Mission of ERS-1, to
provide maps of average sea surface topography - the marine geoid. The
geoid is the fundamental reference surface of geodesy. Through its use
in geoid determination, altimetry aids in revealing the location of ocean
floor features such as faults, trenches, spreading zones, sea mounts and
hot spots. Information may also be gained on the age, structure and dynamics
of the lithosphere, particularly in the area of subduction zones, leading
to a better understanding of the relationship between the lithosphere and
the mantle, and of mantle convection. Additional, commercially valuable
information can be derived on potential locations of oil-bearing structures
using the effect that low density deposits (such as crude oil) have on
the shape of the gravity field. This information has been derived not only
over oceans, but also in the Arctic Ocean, using altimetry over sea ice.
-
Measuring sea state.
The radar altimeter also measures the heights of waves that appear
within its `footprint', and the wind speed at the sea surface. Near real
time measurements of Significant Wave Height (SWH) by the ERS altimeter
are assimilated operationally into wave models to provide wave forecasts,
essential for the optimisation of a range of marine operations.
-
Measuring the topography of the oceans.
Worldwide sea level varies significantly in space and time. Regional
variations in sea level occur as a result of pressure differentials within
the ocean, which result from momentum and heat flux exchange with the atmosphere.
The resultant differences in sea level are thus directly related to ocean
currents. Ocean topography can be measured directly and monitored for change
using the ERS radar altimeter. Along with data from other similar instruments,
the information can be assimilated into ocean circulation models which
transform satellite surface information into three-dimensional descriptions
of ocean currents and transports. An important fluctuation in the ocean-atmosphere
system is the El Nino Southern Oscillation (ENSO) phenomenon, which
causes an increase in ocean temperatures throughout the central and tropical
Pacific which can produce dramatic changes in climate on the timescale
of months to years. The events associated with ENSO can be measured in
sea surface topography by the ERS altimeter, and in sea surface temperature
by the ERS Along Track Scanning Radiometer (ATSR).
4.3 Along Track Scanning Radiometer (ATSR) Applications
Remote sensing data from the ERS-2 ATSR-2 allows the monitoring of agricultural
fires and wildfire distribution on a global scale and in near real time.
All hot spots (including gas flares) with a temperature higher than 312
K at night are precisely located (better that 1 km). Data from the ATSR
sensor is also used for volcano monitoring applications and measuring ocean
skin temperatures.
4.4 Global Ozone Monitoring Experiment (GOME) Applications
Atmospheric ozone and NO2 global monitoring have been going
on since GOME products became available (July 1996). Additional applications
could stem from on-going scientific studies, as GOME data can also be used
for retrieving other trace gases relevant to the ozone chemistry as well
as other atmospheric constituents and climatic variables like clouds, aerosols
and solar index, all of which are crucial for assessing climate change.
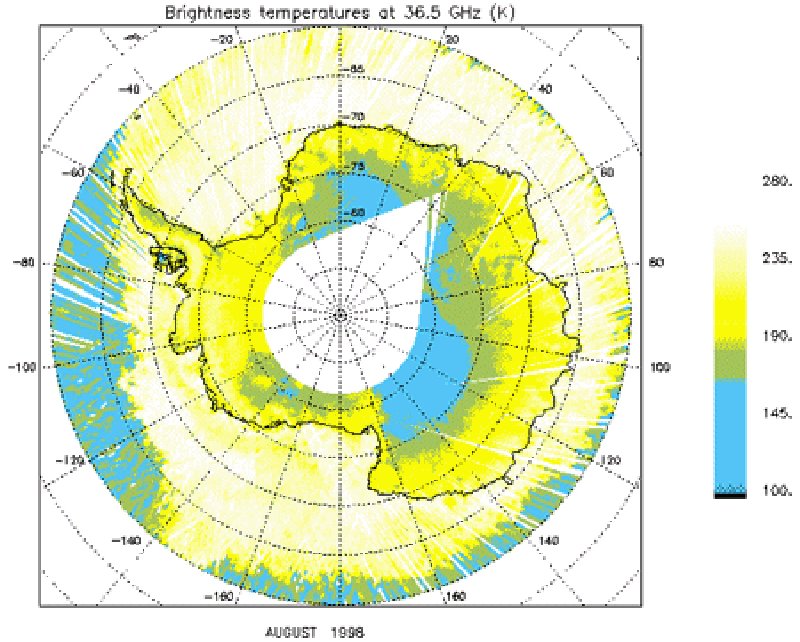
4.5 Microwave Sounder (MWR) Applications
The ERS-2 microwave sounder is being used to monitor the Antarctic ice
cycle. Mapping the radiometric properties of the ice-shelf, which has a
slower time evolution than the atmosphere and the ocean, provides a valuable
input for the understanding of the growth, decay and dynamics of ice sheets.
This in turn is fundamental to the understanding of environmental and climatic
changes.
Monitoring of the Antarctica Ice Cycle
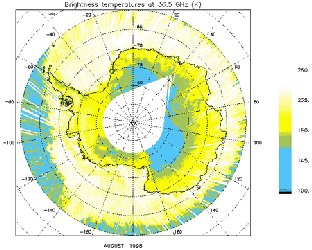
Colours have been chosen so that the free ocean (lowest brightness
temperatures) appears in blue, whereas the sea-ice (warmest
brightness temperatures, due to its high emissivity) is in yellow.
4.6 Synthetic Aperture Radar (SAR) Applications
Observations of the Earth using Synthetic Aperture Radar (SAR) have
a wide range of practical applications, such as:
On the oceans:
-
Most of the man-made illegal or accidental spills are highly visible on
radar images. Ships can be detected and tracked from their wakes. Natural
seepage from oil deposits can also be observed, providing hints for the
oil industries. Scientists are studying the radar backscatter from the
ocean surface which is related to wind and current fronts, eddies, and
internal waves. In shallow waters SAR imagery allows one to infer the bottom
topography. The topography of the ocean floor can be mapped using the very
precise ERS Altimeter, because the sea bottom relief is reflected on the
surface by small variations of the sea surface height.
-
The ocean waves and their direction of displacement can be derived from
the ERS SAR sensor operated in "Wave Mode". This provides input for wave
forecasting and for marine climatology.
-
At high latitudes, SAR data is very useful for regional ice monitoring.
Information such as ice type and ice concentration can be derived and open
leads detected. This is essential for navigation in ice-infested waters.
On the land:
-
The ability of SAR to penetrate cloud cover makes it particularly valuable
in frequently cloudy areas such as the tropics. Image data serve to map
and monitor the use of the land, and are of increasing importance in forestry
and agriculture.
-
Some geological or geomorphological features are enhanced in radar images
thanks to the oblique viewing of the sensor and to its ability to penetrate
(to a certain extent) the vegetation cover.
-
SAR data can be used to georeference other satellite imagery to high precision,
and to update thematic maps more frequently and cost-effectively, due to
its availability regardless of weather conditions.
-
In the aftermath of a flood, the ability of SAR to penetrate clouds is
extremely useful. Here SAR data can help to optimize response initiatives
and to assess damages.
-
Interferometric SAR (InSAR) can be used, under suitable conditions, to
derive elevation models or to detect small surface movements, in the order
of a few centimeters, caused by earthquakes, landslides or glacier advancement.
This interferometric technique has strengthened as a result of the first
ERS-1/ERS-2 Tandem phase, which lasted for about 9 months (until May 1996).
Stereo ERS derived digital elevation
model of part of Lesotho.
|
Katse dam 3-year differential phase
with residual topography. There are
no apparent deformation fringes.
|
185 m concrete arch Katse dam.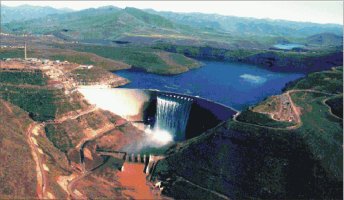
|
The filling of the Katse Dam in Lesotho
has initiated research at UCT to apply
differential InSAR to the mapping of
ground deformation induced by the
loading effect of a large reservoir. |
5. Remote Sensing Applications in the Earth Environment
5.1 Climate monitoring
Climate monitoring concerns the monitoring of the atmosphere and of other
components of the earth system as well as the monitoring of global climate
indicators (e.g. global mean earth surface temperature and precipitation).
Satellite measurements appear to satisfy the need for global measurements.
The earth climate shows great variability over different time scales
spanning from decades to thousands of years and more. Past climatic conditions
are studied by analysing ice cores, sea/lake sediments, shorelines movements,
tree pollen, etc. Numerical experiments are also run in which a Global
Circulation Model is used to explore the possible climatic changes related
to, for example, the Earth axis oscillations. Knowledge of past climate
can help in predicting the future. Abrupt changes may serve in the identification
of thresholds values that can trigger a non-linear behaviour of the earth
system (and hence may cause high variations). The overlapping of climate
variability on different time scales is the very challenge in predicting
climatic changes.
A fundamental role in the determination of the earth climate is played
by the solar radiation reaching the earth affecting the ground surface
energy balance. The radiation spectrum at the earth is strongly influenced
by atmospheric constituents: not only the amount of radiation but also
its spectral distribution is crucial.
5.2 Coastal zone monitoring
5.2.1 Detection of oil spills
One of the most significant environmental concerns worldwide stems from
oil pollution. During the last thirty years, pollution of the world's oceans,
particularly in coastal areas, has become a matter of increasing international
concern. In spite of rigorous controls, deterioration of water quality,
especially in waters subject to heavy shipping, continues at a high rate.
Due to the relative volumes of discharges, illegal emissions from ships
represent a greater long-term source of harm to the environment than infrequent
large scale accidents. Monitoring illegal discharges is thus an important
component in ensuring compliance with marine protection legislation and
the general protection of coastal environments. Traditionally, this service
uses airborne patrols which are expensive and provide often only patchy
coverage. Fast delivery SAR products are proving to be of great value in
the optimisation of air-borne surveillance resources, due to the large
area they can image at any one time. Size, location and dispersement of
the oil spill can be conveniently determined using this type of imagery.
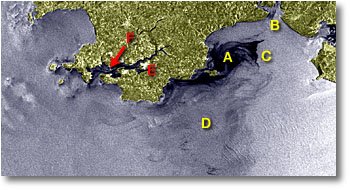
|
|
The Sea Empress, a 147,000 ton supertanker, ran aground on rocks
in the south of Wales, on the evening of February 15th, 1996. Seven days
later, RADARSAT captured this image, clearly delineating the remaining
oil slick. Size, location and disperse-ment of the oil spill can
be conveniently determined using this type of imagery. The spill appears
on the image in black tones.
|
5.2.2 Shallow water bathymetric mapping
SAR imagery, acquired under suitable ocean current and surface wind conditions
allow the bottom topography for an area of tidal sea to be visualised.
This imagery is then used to infer bathymetry using a numerical inversion
procedure. Combining conventional echo sounder data from a survey track
with SAR imagery can shorten survey times considerably, producing a bathymetry
map of the required accuracy and thus representing a major saving in costs.
5.2.3 Ship detection in coastal regions
Knowledge of the whereabouts and activities of ships in coastal regions
is useful to a range of government and law enforcement agencies, such as
those concerned with enforcing legislation regarding fishing activities
in Exclusive Economic Zones, and environmental protection agencies to support
pollution control. The information is also of use to the coastguard for
use both in search and rescue operations and in law enforcement activities,
to supplement land-based coastal surveillance radar which has a maximum
range of under 100 km. It has long been recognised that satellite-based
radar has the ability to detect and monitor vessel traffic. Due to the
nature of the radar, monitoring can take place through cloud cover and
at night thus proving an advantage over optical data. As well as detection
of vessels it is possible to derive various characteristics of each vessel
such as location, speed, heading, and broad class of vessel.
5.3 Land use, forestry and agriculture
In the original mission objectives, observing the land surface was viewed
as an experimental application for ERS-1 data. However, the ability to
monitor crop development and forestry changes independent of weather conditions,
offers a major potential application area for ERS data.
An important technique which has been developed for terrestrial applications
is multitemporal SAR analysis. Three input SAR datasets, acquired at different
times, are assigned the colours red, green or blue. Changes between acquisitions
can then be detected by observing the colours that appear in the image
which reflect the change in the state of land cover. Crops planted at varying
times and developing at varying rates can be identified, increasing the
accuracy with which crop areas can be mapped and acreage estimated. Multitemporal
analysis is also being applied to monitor logging in forested areas.
5.3.1 Agricultural monitoring
Monitoring of the Common Agricultural Policy of the European Union, in
particular the implementation of the so-called `set-aside' agreement in
which farmers are paid subsidies to limit their production, is now undertaken
partly with Earth Observation data. Earth Observation data also provides
a common data source and standardised methodology for the collection of
agricultural statistics. The use of ERS SAR data is gradually being introduced
as part of this effort. Monitoring the scale of global crop production
and trade has been identified as an area in which ERS SAR data may be able
to assist. In particular in South East Asia, several governments are now
looking into the use of ERS data for monitoring their rice crops.
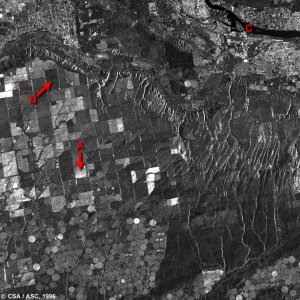
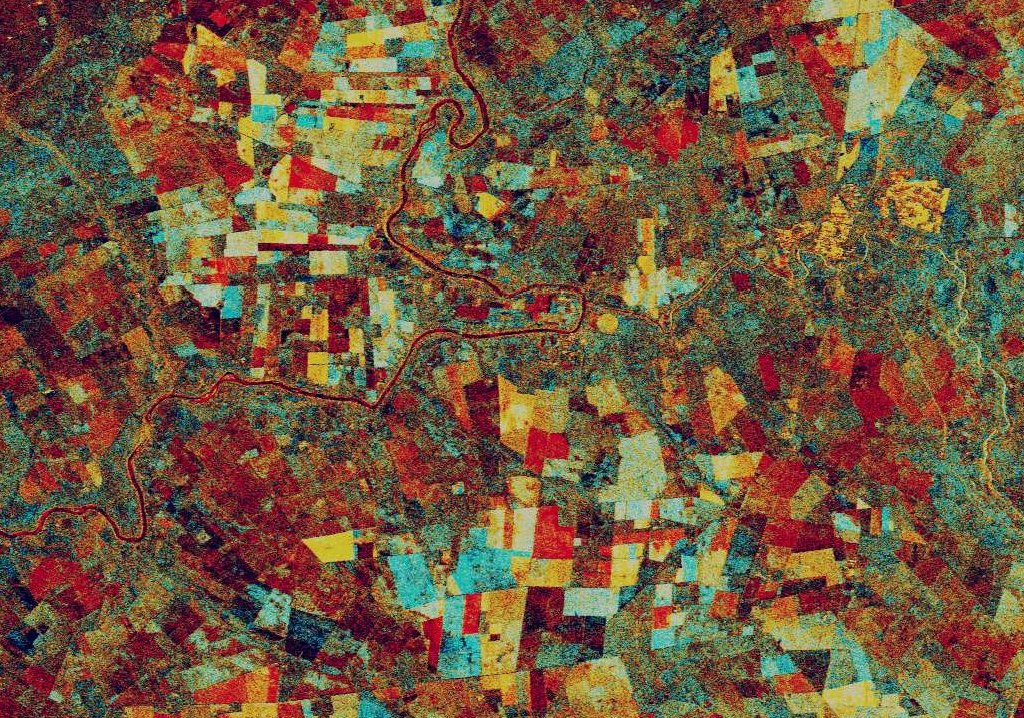
|
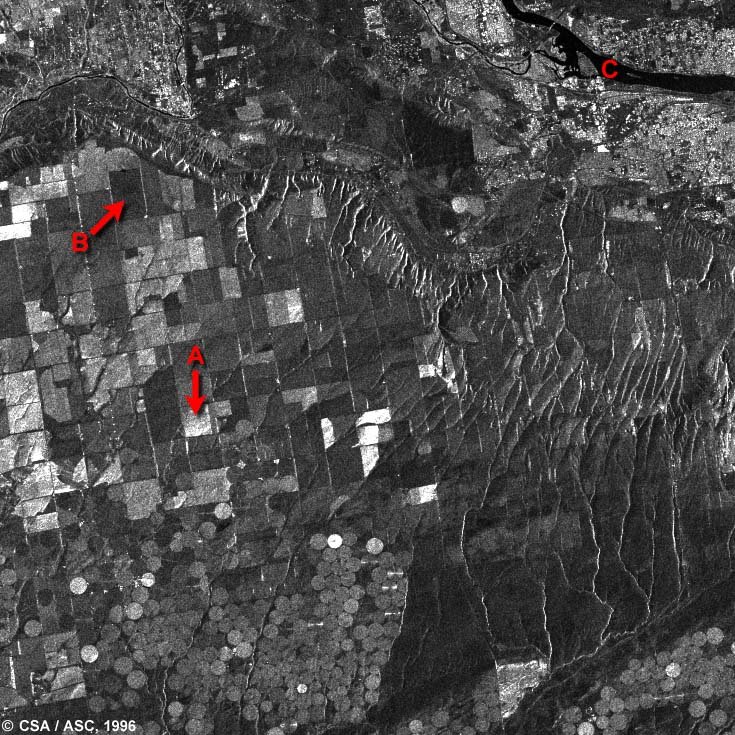
This RADARSAT image shows an agricultural region in the State of Washington.
The circular features seen near the bottom of the image are created by
a central pivot irrigation system. The brighter circles could be indicating
either the presence of vegetation or an increase in the amount of moisture
in those fields. A bit to the north, there is an area characterized by
rectangular field patterns. The brighter fields (A) are vegetated while
the darker (B) are bare. To the east, a striking dendritic drainage pattern
is visible.
|
5.3.2 Tropical forest monitoring
The requirements for information on the world's forests are varied. Some
established mapping and monitoring systems are introducing ERS SAR data,
and other organisations are starting projects as a result of having access
to this new source of data. ERS provides information for maps of forest
extent and type in tropical areas which have not previously been mapped
due to almost continuous cloud cover.
SAR data are being used as the unique data source, and in conjunction
with other remotely sensed data, to map forest damage, the encroachment
of agriculture onto forested areas unsuitable for development, and in general
to provide inventories of timber areas.
5.4 Natural resources exploitation
As known global oil and gas reserves diminish, oil companies are under
a great deal of pressure to tap new sources. In the past few years, exploration
managers have been looking increasingly to frontier areas offshore, such
as the Arctic and South East Asia to supplement existing reserves. Exploration
in these frontier areas brings a whole new set of problems, since these
areas have seldom been surveyed by conventional ship survey methods, and
additional problems may exist through harsh environmental conditions, especially
in the Arctic. In order to make large scale surveying of as yet unexplored
regions as cost-effective as possible, exploration managers are looking
to new methods, such as the use of satellite data.
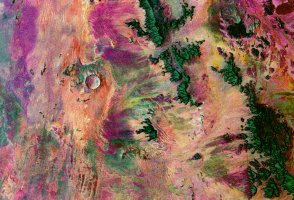
|
A number of studies have been conducted at UCT in which SIR-C and traditional
optical and infra red imaging data have been evaluated for palaeodrainage
and general geological mapping in NW South Africa and Southern Namibia.
This is a SIR-C image of the Roter Kamm meteorite impact crater in Namibia.
Of particular interest was the possibility of surface penetration of the
dry sand in this region by the SIR-C radar bands.
|
The identification and mapping of terrestrial structures related to
hydrocarbon and mineral deposits is the key to many individual applications
within geology, such as general geological mapping and mineral deposit
location. Ground based surveys can often experience difficulty in the detection
and mapping of large scale lineament features which indicate deposits,
whereas they are often readily visible from satellite imagery such as SAR
due to its side look viewing geometry.
5.4.1 Marine gravity anomaly mapping for offshore hydrocarbon exploration
Conventional methods of surveying an offshore area are gravity, magnetic
and seismic surveys by ship, which are labour intensive and expensive especially
on a regional scale for the purposes of preliminary surveying. Gravity
anomaly maps derived from altimetry from ERS and other satellite missions
provide an alternative to these expensive ship surveys for a regional overview
of the potential existence and position of viable deposits. The expense
involved in such a survey is so vast that even small percentage savings
on current operational costs make the use of satellite-derived alternatives
very attractive to industry. The ERS-1 Geodetic Mission, completed in 1994,
provides geographically uniform coverage up to latitudes of 82 N, of a
relatively high spatial resolution dataset for deriving gravity anomaly.
5.4.2 Basin screening for natural oil seepage
Natural oil slicks on the sea surface due to seepage arising from sub-sea
hydrocarbon deposits can be identified and analysed using ERS SAR images.
It requires a considerable volume of data as the location of the oil-bearing
structures must be studied using data over a long time series. However,
combined with satellite-derived gravity maps which reflect the regional
structure of the lithosphere, the economic potential of a particular basin
for hydrocarbon exploitation can be estimated. The financial implications
in the provision of such a service are considerable. Savings in time and
expenses that are realisable using these methods provide a potential market
estimated to be in the region of US $5-10 million per annum worldwide.
5.4.3 Identification of terrestrial mineral deposits
There is already a high degree of acceptance of the use of optical EO data
in geological mapping applications due to the logistics and economics involved
in locating features such as base metal deposits or hydrocarbon reserves.
Unique properties of SAR data are now being exploited to aid further the
exploitation of natural resources by detecting the lineament features and
anti-cline structures which may indicate the presence of mineral deposits.
Due to it's side look viewing geometry SAR data is particularly effective
in identifying these geological features, and in detecting them even when
masked by vegetation.
5.5 Map compiling and updating
Highly developed areas of the world have been mapped to a very high accuracy
and precision, using ground and aerial surveying methods which are on the
whole expensive and labour intensive. However, particularly in the frontier
regions where an impact from human development is being felt, the land's
topography is still poorly mapped and any existing maps are out-of-date
or of insufficient scale. A cost-effective method is required for the production
of new maps, and updating old ones.
The world's mapping industries are currently experiencing rapid technological
and organisational change. Increasingly, information is needed in digital
formats enabling sophisticated analysis to be undertaken, producing products
such as digital terrain models, over which land cover information can then
be draped. Digital data are also of great value in the rapidly expanding
market for GISs, which are now being used extensively to integrate data
from different sources for land management, monitoring and planning.
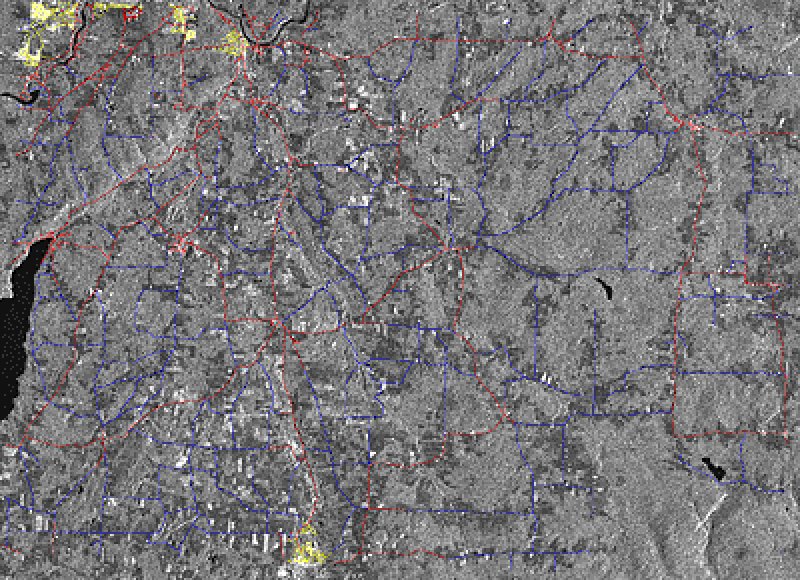
Ortho-Rectified Radarsat-SAR Fine Mode Image
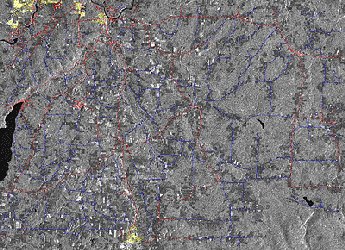
Main Streets in red
Secondary Roads in blue
City Streets in white
The cartography market has always been important in the development
of commercial applications of EO data, and ERS is no exception. The use
of ERS-1 SAR data is providing a marked improvement in the accuracy of
maps produced for developing countries. The SAR data are being combined
with data from optical sensors such as SPOT to help increase the thematic
and in particular the geolocation accuracy of the latter. The use of interferometric
techniques for the production of digital elevation models is potentially
a major application of SAR data. Topographic maps are being compiled from
ERS data for areas of the world not previously mapped because of their
remote location and high frequency of cloud coverage. This information
is of value to a range of activities, from managing land-use development
to planning logistics of deposit exploration.
5.6 Marine environment: hazards and risks
Earth observation data from the ERS satellite is helpful in the assessment
and/or forewarning of a range of environmental risks and hazards in the
marine environment, whether natural or manmade. Warning or forecasting
systems may cover: risk assessment and management, hazard monitoring and
forecasting, warning formulation, transmission and dissemination of warnings,
and response mechanisms.
The emphasis of the use of spaceborne SAR data for monitoring sea ice
and illegal oil spills is in complementing existing data sources, and optimising
conventional monitoring and response mechanisms. This is due to the temporal
and spatial coverage characteristic of satellites. ERS-2 Low Bit Rate data
however, which is acquired more or less continuously, can provide the primary
data source for certain marine services, where data collected from in-situ
measurement techniques such as buoys do not exist.
5.6.1 Forecasting sea state for offshore operations and marine engineering
Marine conditions change very rapidly and can vary considerably between
locations only a few kilometres apart. Errors in the planning of marine
operations dependent on favorable conditions can be economically damaging,
and in extreme cases even cost human lives. Consequently, weather and sea-state
forecasts are critical to activities such as ship routing, fishing, management
of offshore operations and coordinating rescue services, all of which require
accurate and reliable information within a few hours of observation. To
serve this marine market, the ERS Low Bit Rate fast delivery data stream,
the development of appropriate ocean and weather forecasting models and
data assimilation schemes, and an operational mobile communications infrastructure
are all essential components.
The use of fast-delivery products from the ERS series radar altimeter,
scatterometer, SAR and ATSR instruments can improves the accuracy and coverage
of weather and sea-state forecast services. ERS offers consistent and geographically
homogeneous data, for monitoring and forecasting of frontier areas where
such a service did not previously exist, due to lack of sufficient coverage
by ships of opportunity.
5.6.2 The climatology of marine areas for offshore operations
Information on the local climatology of waves is important in minimizing
risks for a wide range of marine activities, such as locating offshore
installations, planning offshore operations, for coastal defence planning
and for the planning of naval exercises and other major ship routing operations.
Time series of sea state information are being developed as a basis
for predicting conditions. For information on wave height, there exists
presently ten years worth of data available from the Geosat, Topex-Poseidon
altimeters as well as the ERS series. As this time series lengthens, the
value of the information increases in terms of the ability to estimate
seasonal climatologies, and predict extreme wave parameters such as the
50 year return waveheight. Information on the climatology of wave period
and direction can also be derived from ERS instruments, useful modelling
oscillations in coupled structures such as when fixing a riser pipe to
an oil rig.
5.6.3 Sea ice monitoring and navigation for Arctic operators
Daily sea-ice information is required for navigation during winter throughout
the northern Baltic, around Svalbard, the Greenland Sea, along the east
coasts of Canada and northern USA, the Great Lakes, and during summer in
the European, Russian and Canadian Arctic. Three to seven day forecasts
are also needed for strategic planning. The type of information required
includes location of the ice edge, estimates of ice type and it's concentration.
Also important is measurement of ice drift and speed.
The efficacy of Fast Delivery ERS SAR data has been demonstrated within
well-established national sea-ice services. This use is based mainly upon
manual interpretation, and is used as a complementary data source to traditional
satellite sources such as Passive Microwave Radiometry, and low resolution
optical data. In parallel, value-adding companies within Europe are developing
the next generation of workstation which incorporate new techniques from
the science community in order to automate feature interpretation and tracking.
Additionally, demonstrations are being made of the use of ERS SAR data
for shipping and offshore activities close to the ice edge.
5.7 Natural disasters
5.7.1 Volcanoes
Ground-based measurements of volcano deformation can be used to assess
eruptive hazard, but require the costly (and often hazardous) installation
and maintenance of instrument network. It has been demonstrated that spaceborne
radar interferometry can be used to monitor long term volcano deformation.
The deformation associated with the last large eruption of Mount Etna (1991-93)
was measured and interpreted using the InSAR technique for the first time
on a volcano.
Guagua Pichincha Volcano
|
Satellite images are revealing the growth of a lava dome. The appearance
of such a new lava dome is significant because (1) it signals the presence
of new magma within the volcano and (2) dome growth at volcanoes such as
Guagua Pichincha is typically accompanied by explosive activity.
|
5.7.2 Earthquakes and Landslides
The magnitude 7.3 Landers earthquake of 28 June 1992 ruptured over 85 km
along a complex fault system in the Mojave Desert of California. The Landers
earthquake sequence provided an ideal test case for radar interferometry,
because its shallow depth produced spectacular surface rupture in an arid
area less than three months after the ERS-1 satellite began acquiring radar
images in its 35-day orbital cycle. With 20 fringes in the shape of a crushed
butterfly, the first earthquake interferogram illustrated the coseismic
deformation field with over a million pixels.
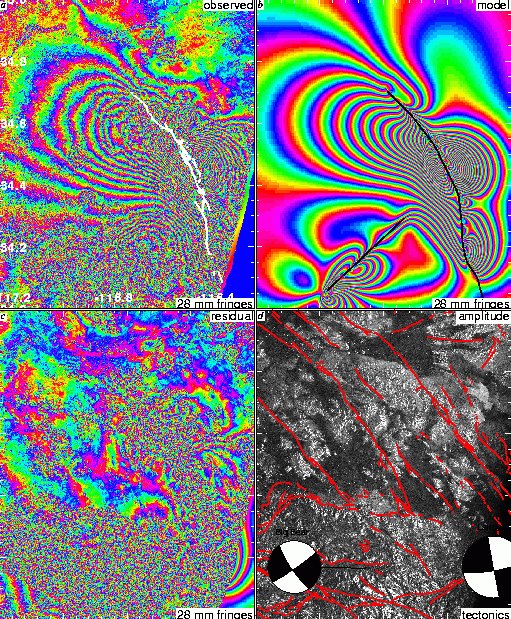
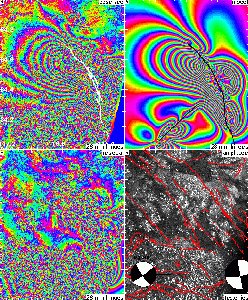
Landers Earthquake
|
|
(a) Observed interferogram calculated from ERS-1 SAR images taken before
(April 24, 1992) and after (June 18, 1993) the earthquake. Each fringe
in parts a, b and c denotes 28 mm of change in range. The asymmetry between
the two sides of the fault is due to the curvature of the fault and the
geometry of the radar. Black lines denote the surface rupture mapped in
the field. The altitude of ambiguity is 220 m.
(b) Modeled interferogram with black lines denoting fault patches included
in the elastic dislocation model.
(c) Residual (observed minus modeled) interferogram.
(d) Radar brightness (amplitude) image. |
5.7.3 Floods
Bad weather and therefore dense cloud cover usually accompany floods, and
therefore optical sensors cannot be used for monitoring purposes. Radar
satellites, however, can penetrate the cloud cover with their microwaves,
and thus deliver valuable information for future planning and prevention.
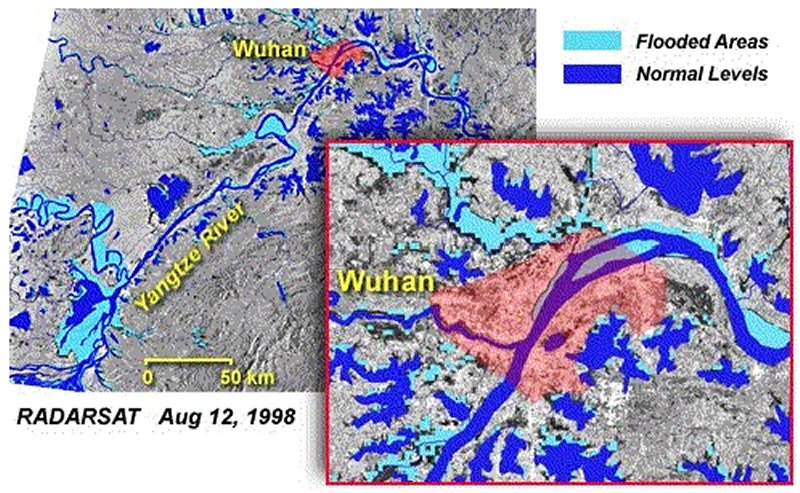
Flooding on the Yangtze River, China
|
|
The RADARSAT ScanSAR narrow data were acquired on August 12, 1998 at
6:20 AM local time.
GIS data were overlaid on the RADARSAT image to provide a map reference
for normal water levels.
The resulting image displays non-flooded areas in grey tones, normal
waters levels in dark blue, flooded areas in light blue and the urban area
of the city of Wuhan in red.
|
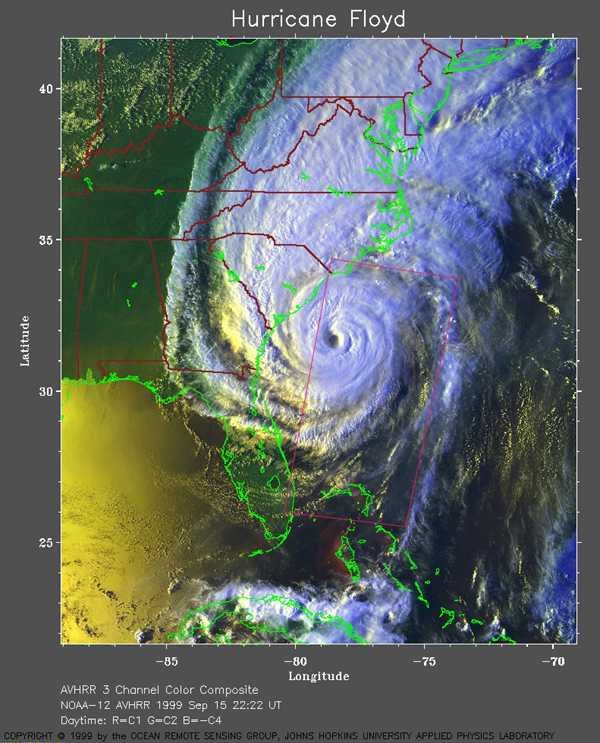
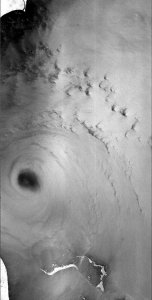
5.7.4 Hurricanes
RADARSAT transmits a microwave frequency known as C-band (with a wavelength
of about 5.6 cm). The RADARSAT images are a measure of the amount of energy
reflected back to the radar antenna following interaction of the transmitted
pulse with the ocean's surface. The degree of backscatter depends on the
roughness of the surface at the scale of the radar wavelength. For the
ocean surface, the short scale roughness is influenced primarily by the
surface wind speed. Unlike optical sensors, radar waves can penetrate all
weather conditions including clouds and rain. Having an all-weather imaging
capability makes radar unique in being able to detect the effects of hurricanes
on the ocean surface with high spatial resolution. The hurricane features
visible in the RADARSAT imagery are an imprint of the hurricane on the
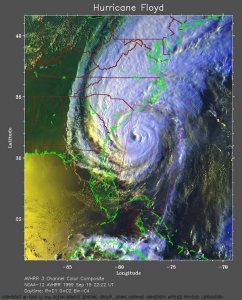
ocean surface roughness. In the RADARSAT imagery, the eye of the hurricane
appears darker than its surrounding area because the wind speed at the
centre of the hurricane is lower.
AVHRR Image of
Hurricane Floyd
|
|
RADARSAT Image of
Hurricane Floyd
|
6. Conclusions
It has been shown that there is a wide range of applications for satellite
imaging radar products. Furthermore, ongoing research and development is
continually expanding the current range of applications. One of the most
important characteristics of imaging radars is their ability to penetrate
cloud cover and to acquire data either by day or by night. It is this all-weather
capability that has contributed significantly to the many commercial applications
of satellite imaging radar.
References
-
[1]
-
M.G. Abdelsalam, C. Robinson, F. El-Baz and R.J. Stern, "Applications of
Orbital Imaging Radar for Geologic Studies in Arid Regions: The Saharan
Testimony," Photogrammetric Engineering & Remote Sensing, vol.
66, no. 6, pp. 717-726, June 2000.
-
[2]
-
A. Beaudoin, T. LeToan, S. Goze, E. Nezry, A. Lopes, E. Mougin, C.C. Hsu,
H.C. Han, J.A. Kong and R.T. Shin, "Retrieval of forest biomass from SAR
data," Int. Journal of Remote Sensing, vol. 15, no. 14, pp. 2777-2796,
1994.
-
[3]
-
C. Bechini, P. Canuti, S. Moretti, S. Paloscia and P. Pampaloni, "Microwave
remote sensing for hydrological and agricultural monitoring," Proc.
of 24th Int. Symp. on Remote Sens. Environ., ERIM, pp. 27-31, 1991.
-
[4]
-
J. Cihlar, "Land Cover Mapping of Large Areas from Satellites: Status and
Research Priorities," Int. Journal of Remote Sensing , vol. 21,
no. 6/7, 2000.
-
[5]
-
M. Coltelli, G. Fornaro, G. Franceschetti, R. Lanari, M. Migliaccio, J.R.
Moreira, K.P. Papathanassiou, G. Puglisi, D. Riccio and M. Schwabisch,
"SIR-C / X-SAR multifrequency multipass interferometry: A new tool for
geological interpretation," Journal of Geophysical Research, vol.
101, pp. 23127-23148, 1996.
-
[6]
-
M. D'Errico, A. Moccia and S. Vetrella, "High-frequency observation of
natural disasters by SAR interferometry," Photogramm. Eng. and Remote
Sensing, vol. 61, no. 7, pp. 891-898, 1995.
-
[7]
-
M.C. Dobson, L.E. Pierce, K. Sarabandi, F.T. Ulaby and T. Sharik, "Preliminary
analysis of ERS-1 SAR for forest ecosystem studies," IEEE Trans. Geosci.
Remote Sensing, vol. 30, no. 2, pp. 203-211, 1992.
-
[8]
-
M.C. Dobson, F.T. Ulaby and L.E. Pierce, "Land-cover classification and
estimation of terrain attributes using synthetic aperture radar," Remote
Sensing of Environment, vol. 51, no. 1, pp. 199-214, 1995.
-
[9]
-
G.S. Doyle and M.R. Inggs, "Dual Frequency Multi-Polarimetric SAR as a
Tool for Palaeo-Drainage Mapping in the Northern Cape Province," IEEE
Proc. of the South African Symp. on Communications and Signal Processing,
COMSIG'98, Cape Town, South Africa, pp. 339-342, September 1998.
-
[10]
-
G.S. Doyle, M.R. Inggs, C.J.H. Hartnady and E. Rignot, "The Use of Interferometric
SAR in a Study of Reservoir Induced Crustal Deformation," Proc. European
Conference on Synthetic Aperture Radar, EUSAR'98, Friedrichshafen,
Germany, pp. 95-98, May 1998.
-
[11]
-
G.S. Doyle, A.J. Wilkinson and M.R. Inggs, "Contending with High Relief
and Temporal Decorrelation in an InSAR Study of the Effects of Reservoir
Loading," Proc. IEEE Geosci. Remote Sensing Symp., IGARSS'99, Hamburg,
Germany, June 1999.
-
[12]
-
M.R. Drinkwater, R. Hosseinmostafa and P. Gogineni, "C-Band backscatter
measurements of winter sea ice in the Weddell Sea, Antarctica," Int.
Journal of Remote Sensing, vol. 16, no. 17, pp. 3365-3389, 1995.
-
[13]
-
P.C. Dubois, J. van Zyl and T. Engman, "Measuring soil moisture with imaging
radars," IEEE Trans. Geosci. Remote Sensing, vol. 33, no. 4, pp.
915-926, 1995.
-
[14]
-
C. Elachi, "Spaceborne imaging radar: Geologic and oceanographic applications,"
Science,
vol. 209, pp. 1073-1082, 1980.
-
[15]
-
C. Elachi, Y. Kuga, K.C. McDonald, K. Sarabandi, T.B.A. Senior, F.T. Ulaby,
J.J. van Zyl, M.W. Whitt and H.A. Zebker, "Radar polarimetry for geoscience
applications," F.T. Ulaby and C. Elachi editors, Artech House, Inc., 1990.
-
[16]
-
L.V. Elizavetin and E.A. Ksenofontov, "Feasibility of precision-measurement
of the Earth's surface-relief using sar interferometry data," Earth
Observation and Remote Sensing, vol. 14, pp. 101-121, 1996.
-
[17]
-
D.L. Evans, "Geologic process studies using synthetic aperture radar (SAR)
data," Int. Union of Geological Sciences, Episodes, vol. 15, pp.
21-31, 1992.
-
[18]
-
D.L. Evans, T.G. Farr, H.A. Zebker, J.J. van Zyl and P.J. Mouginis-Mark,
"Radar interferometry studies of the Earth's topography," Eos Trans.
American Geophys. Union, vol. 73, no. 52, pp. 553-558, 1992.
-
[19]
-
T.G. Farr and O.A. Chadwick, "Geomorphic processes and remote sensing signatures
of alluvial fans in the Kun Lun Mountains, China," Journal of Geophysical
Research, vol. 101, no. E10, pp. 23,091-23,100, 1996.
-
[20]
-
K.L. Feigl, D.C. Agnew, Y. Bock, D. Dong, A. Donnellan, B.H. Hager, T.A.
Herring, D.D. Jackson, T.H. Jordan, R.W. King, S. Larsen, K.M. Larson,
M.H. Murray, Z.K. Shen and F.H. Webb, "Space geodetic measurement of crustal
deformation in Central and Southern California, 1984-1992," Journal
of Geophysical Research Solid Earth, vol. 98, pp. 21677-21712, 1993.
-
[21]
-
E.J. Fielding, C.L. Werner, T.G. Farr and G.F. Peltzer, "Geomorphic applications
of digital elevation models derived from ERS-1 and SIR-C SAR interferometry,"
EOS
Trans AGU, vol. 76, pp. 64, 1995.
-
[22]
-
G.M. Foody, M.B. McCulloch, and W.B. Yates, "Crop classification from C-band
polarimetric radar data," Int. Journal of Remote Sensing, vol. 15,
no. 14, pp. 2871-2886, 1994.
-
[23]
-
A. Freeman, D.L. Evans and J.J. van Zyl, "SAR applications in the 21st
century," Int. Journal of Electronics and Communications, vol. 50,
pp. 79-84, 1996.
-
[24]
-
K.B. Fung, S.M. Yatabe, T.J. Pultz and G. Fedosejevs, "Application of Remote
Sensing to Environmental Monitoring: A Case Study of the 1996 Saguenay
Flood in Québec," Quebec '98 Conference, Annual meeting of the
Geological Association of Canada/Mineralogical Assoc. of Canada, May
1998.
-
[25]
-
R. Gens and J.L. Vangenderen, "SAR interferometry: Issues, techniques,
applications," Int. Journal of Remote Sensing, vol. 17, pp. 1803-1835,
1996.
-
[26]
-
R.M. Goldstein, T.P. Barnett and H.A. Zebker, "Remote sensing of ocean
currents," Science, vol. 246, pp. 1282-1285, 1989.
-
[27]
-
H.A. Hovland, J.A. Johannessen and G. Digranes, "Slick Detection in SAR
Images," Proc. IEEE Geosci. Remote Sensing Symp., IGARSS'94, Pasadena,
USA, pp. 2038-2040, 1994.
-
[28]
-
M.L. Imhoff and S.W. McCandless, "Flood boundary delineation through clouds
and vegetation using L-band space-borne radar: A potential new tool for
disease vector control programs," Acta Astronautica, vol. 17, no.
9, pp. 1003-1007, 1988.
-
[29]
-
M.R. Inggs and R.T. Lord, "Interpolating Satellite Derived Wind Field Data
Using Ordinary Kriging, with Application to the Nadir Gap," IEEE Trans.
on Geosc. and Remote Sensing, vol. 34, no. 1, pp. 250-256, January
1996.
-
[30]
-
I. Joughin, D. Winebrenner, M. Fahnestock, R. Kwok and W. Krabill, "Measurement
of ice-sheet topography using satellite radar interferometry," Journal
of Glaciology, vol. 42, no. 140, 1996.
-
[31]
-
R. Kwok, S.V. Nghiem, S.H. Yueh and D.D. Huynh, "Retrieval of thin ice
thickness from multifrequency polarimetric sar data," Remote Sensing
of Environment, vol. 51, no. 3, pp. 361-374, 1995.
-
[32]
-
T.I. Lukowski, P. Budkewitsch, F. Charbonneau and J. Stix, "RADARSAT-1
Interferometric Potential for Monitoring Volcanic Activity: The Guagua
Pichincha Volcano, Ecuador," Proc. IEEE Geosci. Remote Sensing Symp.,
IGARSS 2000, Honolulu, Hawaii, July 2000.
-
[33]
-
J.T. Macklin and N.R. Stapleton, "Radar backscatter statistics from the
sea surface: Implications of SIR-C/X-SAR observations from the NE Atlantic,"
Journal
of Geophysical Research - Oceans, vol. 103, no. C9, pp. 18,827-18,838,
1998.
-
[34]
-
D. Massonnet and K.L. Feigl, "Radar Interferometry and its Application
to Changes in the Earth's Surface," Reviews of Geophysics, vol.
36, no. 4, pp. 441-500, 1998.
-
[35]
-
D. Massonnet, M. Rossi, C. Carmona, F. Adragna, G. Peltzer, K.L. Feigl
and T. Rabaute, "The Displacement Field of the Landers Earthquake Mapped
by Radar Interferometry," Nature, vol. 364, pp. 138-142, July 1993.
-
[36]
-
P.J. Mouginis-Mark, "Volcanic hazards revealed by radar interferometry,"
Geotimes,
vol. 39, no. 7, pp. 11-13, 1994.
-
[37]
-
P.J. Mouginis-Mark, S. Rowland, R. Francis, T. Friedman, H. Garbeil, J.
Gradie, S. Self, L. Wilson, J. Crisp, L. Glaze, K. Jones, A. Kahle, D.
Pieri, H. Zebker, C. Wood, W. Rose, J. Adams and R. Wolff, "Analysis of
active volcanoes from the Earth Observing System," Remote Sensing of
Environment, vol. 36, pp. 1-12, 1991.
-
[38]
-
P.A. Rosen, S. Hensley, I. Joughin, F. Li, S. Madsen, E. Rodriguez and
R.M. Goldstein, "Synthetic aperture radar interferometry," Proc. of
the IEEE, vol. 88, no. 3, pp. 333-382, 2000.
-
[39]
-
S. Saatchi, J.V. Soares and M. Alves, "Mapping deforestation and land use
in Amazon Rainforest by using SIR-C imgery," Remote Sensing of Environment,
vol 59, no. 2, pp. 191-202, 1997.
-
[40]
-
C.C. Schmullius and D.L. Evans, "Synthetic aperture radar (SAR) frequency
and polarization requirements for applications in ecology, geology, hydrology,
and oceanography: a tabular status quo after SIR-C/X-SAR," Int. Journal
of Remote Sensing, vol. 18, no. 13, pp. 2713-2722, 1997.
-
[41]
-
J. Shi and J. Dozier, "Inferring snow wetness using C-band data from SIR-C's
polarimetric synthetic aperture radar," IEEE Trans. Geosci. Remote Sensing,
vol. 33, no. 4, pp. 905-914, 1995.
-
[42]
-
J.V. Soares, Renno, Formaggio, C. Yanasse and Frery, "An investigation
on the selection of texture features for crop discrimination using SAR
imagery," Remote Sensing of Environment, vol. 59, no. 2, pp. 234-247,
1997.
-
[43]
-
T. Toutin, "Road Extraction from Stereo RADARSAT Data," Proc. of the
19th International Cartographic Conference `Touch the Past, Visualize the
Future', Ottawa, Ontario, Canada, pp. 1479-1487, August 14-21 , 1999.
-
[44]
-
T. Toutin and A.L. Gray, "State-of-the-art of extraction of elevation data
using satellite SAR data," ISPRS Journal of Photogrammetry and Remote
Sensing, vol. 55, no. 1, pp. 13-33, 2000.
-
[45]
-
P.W. Vachon, K. Katsaros, P. Black and P. Dodge, "RADARSAT Synthetic Aperture
Radar Measurements of some 1998 Hurricanes," Proc. IEEE Geosci. Remote
Sensing Symp., IGARSS'99, Hamburg, Germany, July 1999.
-
[46]
-
H.A. Zebker, P.A. Rosen and S. Hensley, "Atmospheric Effects in Interferometric
Synthetic Aperture Radar Surface Deformation and Topographic Maps," Journal
of Geophysical Research, vol. 102, no. B4, pp. 7547-7563, April 1997.
-